Storyboarding with Python Visualization
I have worked on a project at Ontario Tech University to find out the role of Twitter in the federal election of 2019. The project was based on python programming and visualizations. I started finding the sentiment of Canadians on liberal and conservative parties. I extensively used Python code to understand the sentiments of Canadians and used different visualization techniques such as pie chart, bar chart, Line diagram and network analysis for understand the sentiments. I added many visuals to understand the sentiments of Canadians related to different parties, immigration, and Refugees. Here we have updated some of my work.
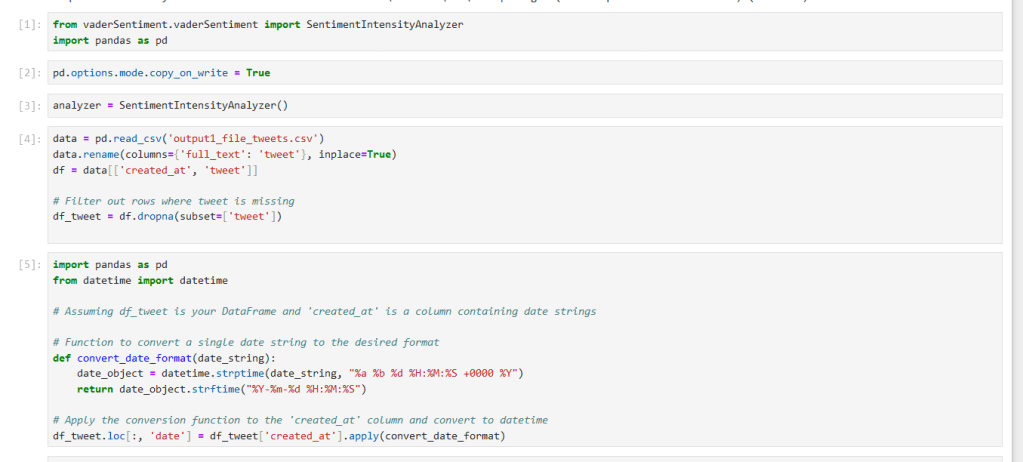
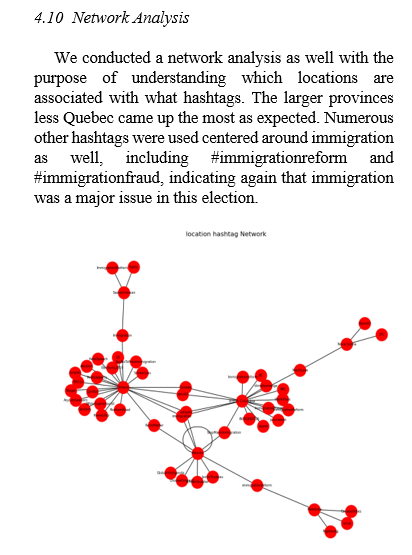
I have added a sample Python code that I have used in my project. I also did network analysis to find the various relationships between locations and hashtags.
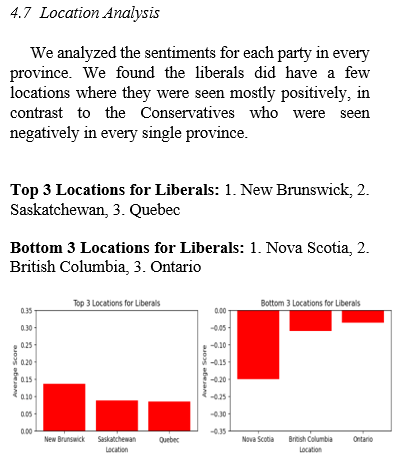
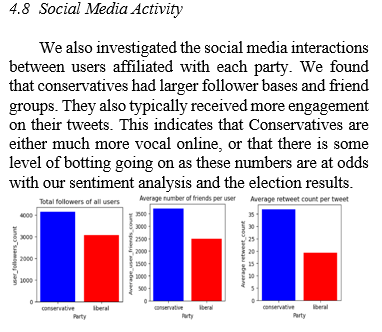
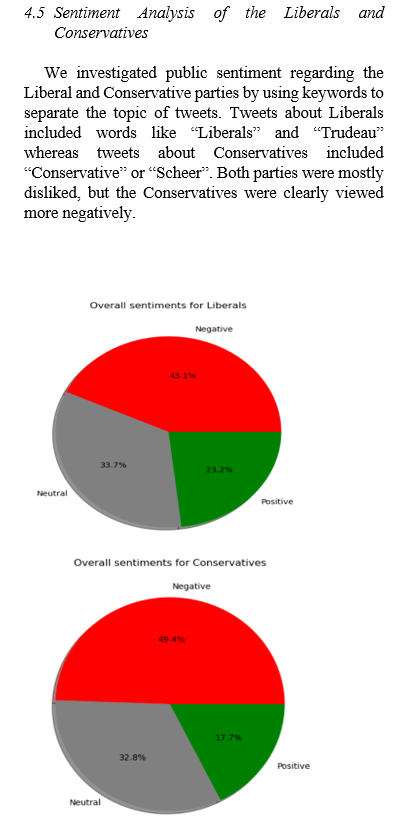
We have also done details social media and location analysis to find the acceptance of the parties among Canadians.
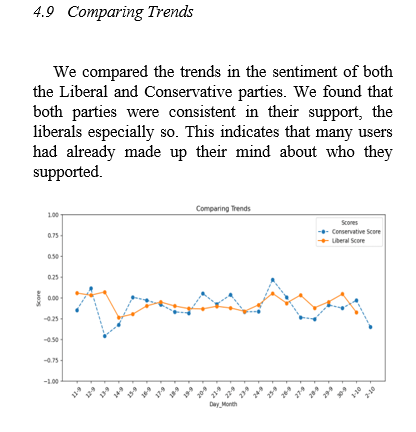
Finally, I compared trends to identify the sentiment of Canadians regarding political parties over time.