Infographics on Global Warming
In one of the projects at Ontario Tech University, I created Infographics on global warming. I have attached my work in the link.
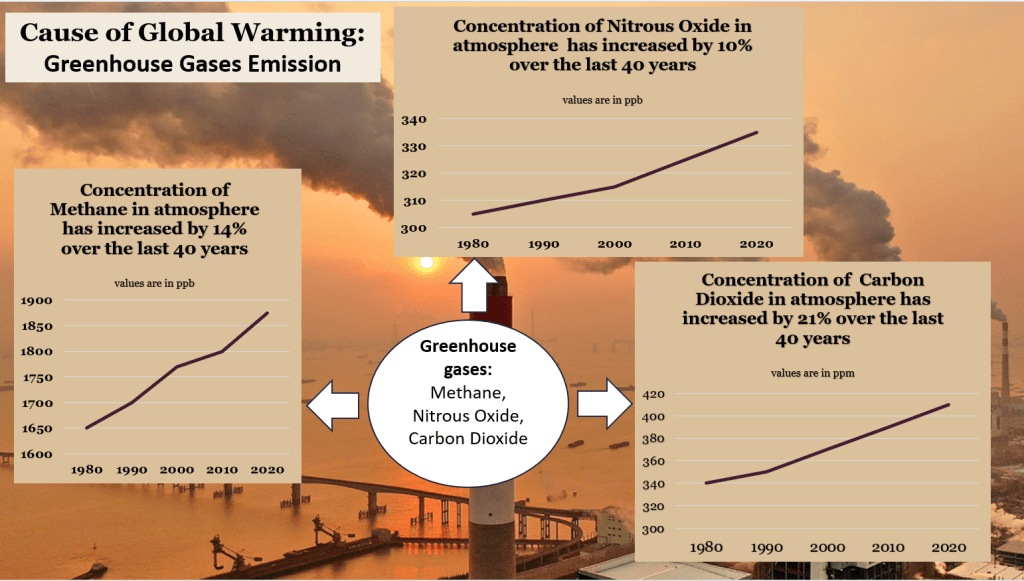
Causes of Global Warming :
Greenhouse gases like Methane, Nitrous Oxide, and Carbon Dioxide. are the main causes of global warming. The Picture depicts how these increased over time.
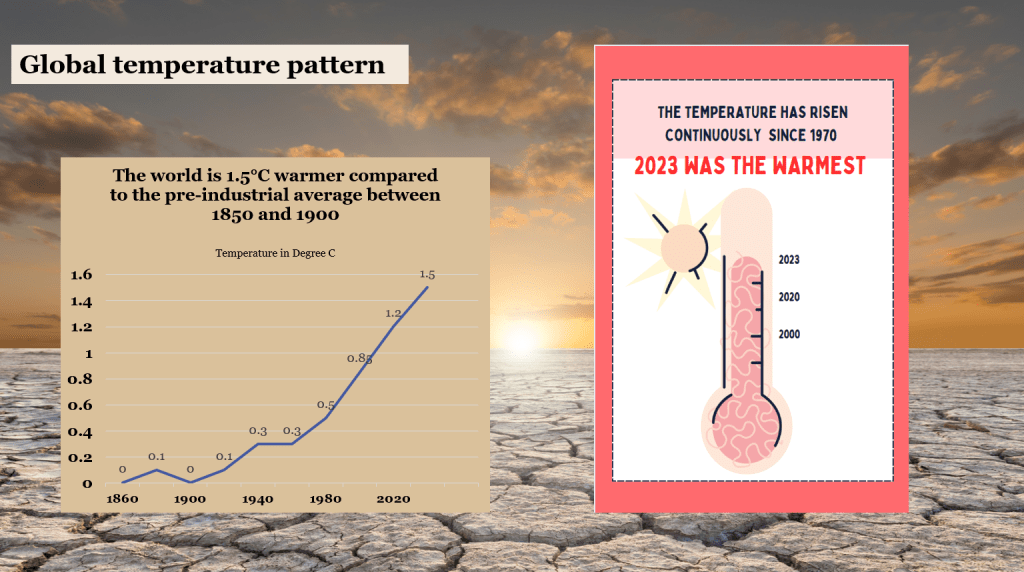
The picture shows the global temperature rise from 1860 to 2024. The year 2023 was the warmest, with an average temperature of 1.5 degrees C higher than its pre-industrial average.
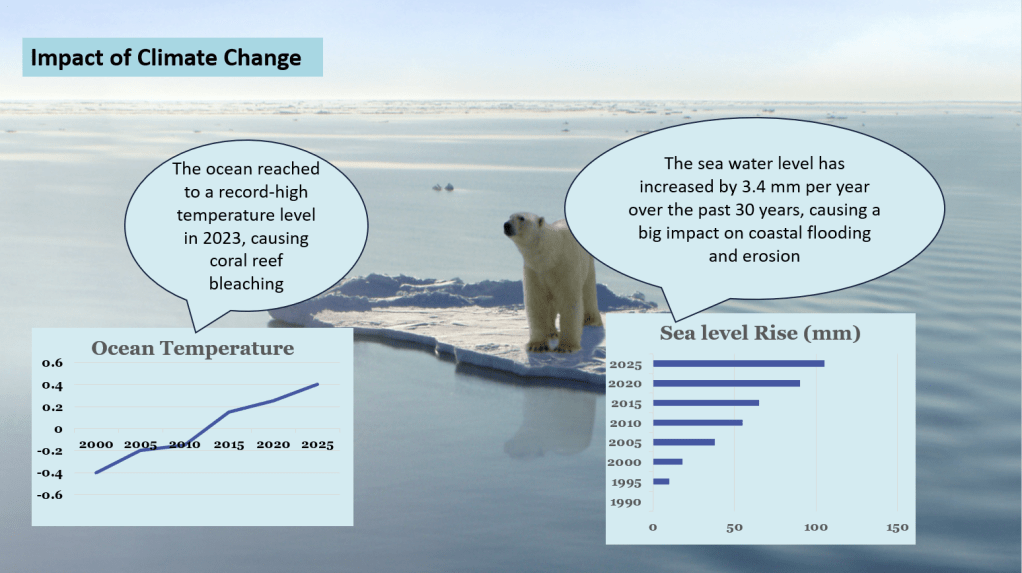
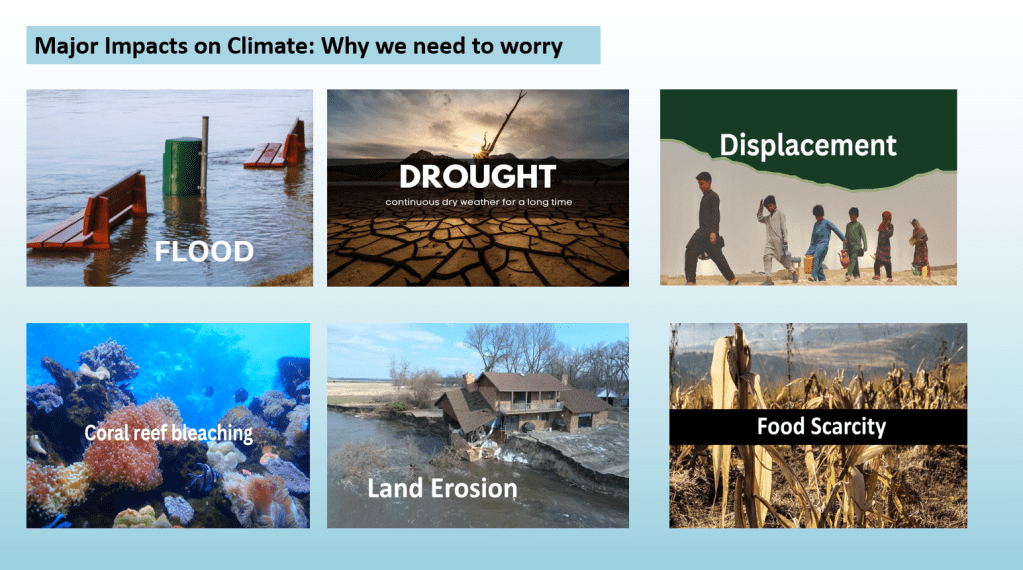
We can observe many impacts of climate changes such as the rise of ocean temperature, increased sea level, etc. as depicted in the above pictures.
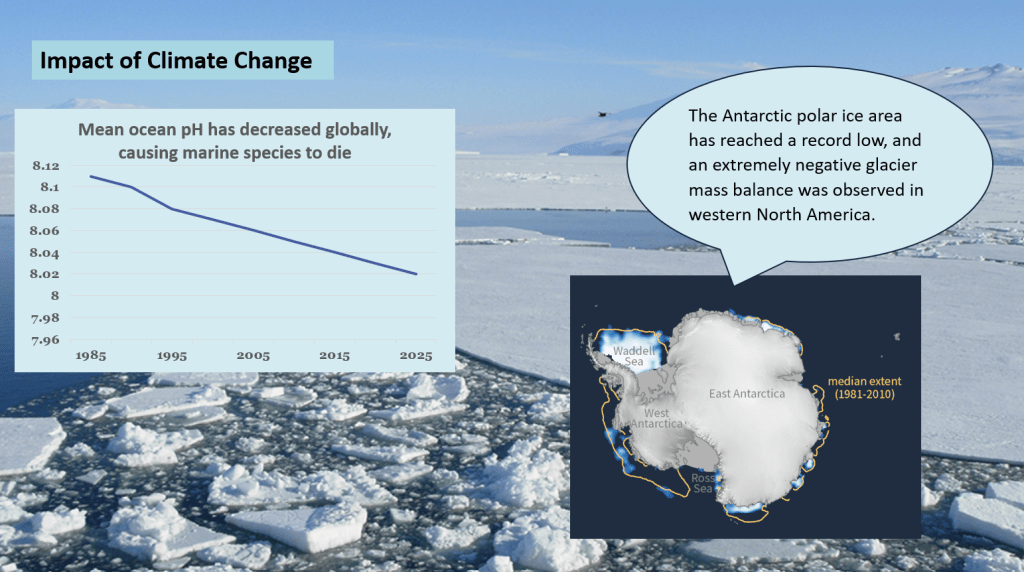
The results of global warming is depicted in the picture
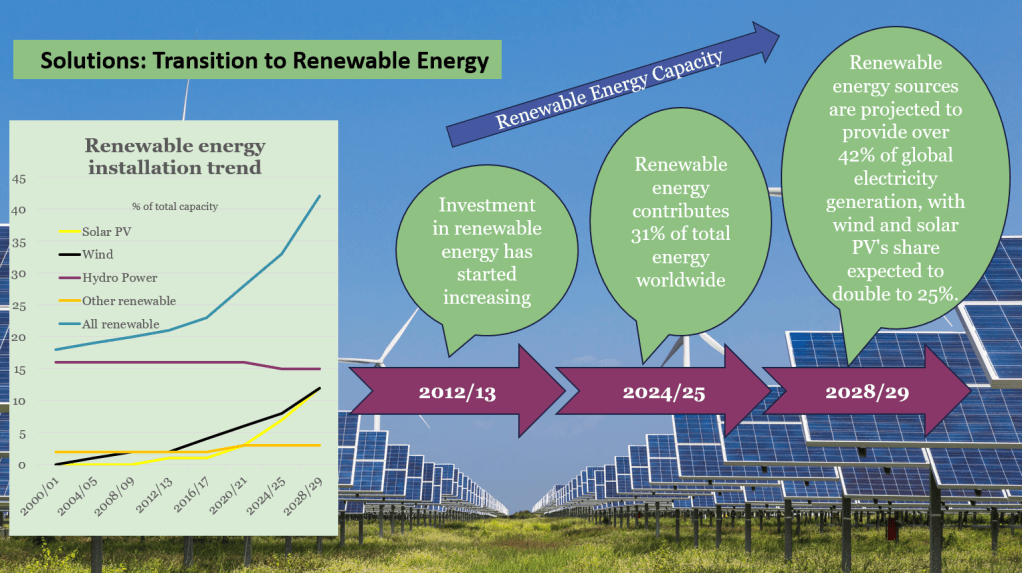
To fight Global warming, we need to reduce our greenhouse gas emissions. We need to promote renewable energy installation. The diagram tells us that the share of renewable energy is continuously increasing over time.
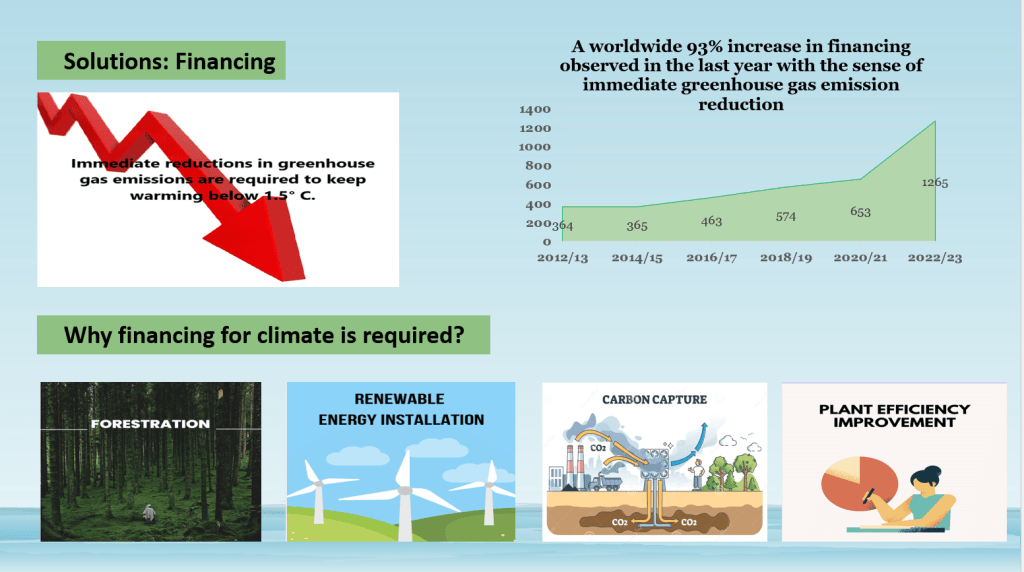
Climate financing is one of the options to fight with Global warming. It provides financing for forestation, renewable energy installation, carbon capture, and plant efficiency improvement.
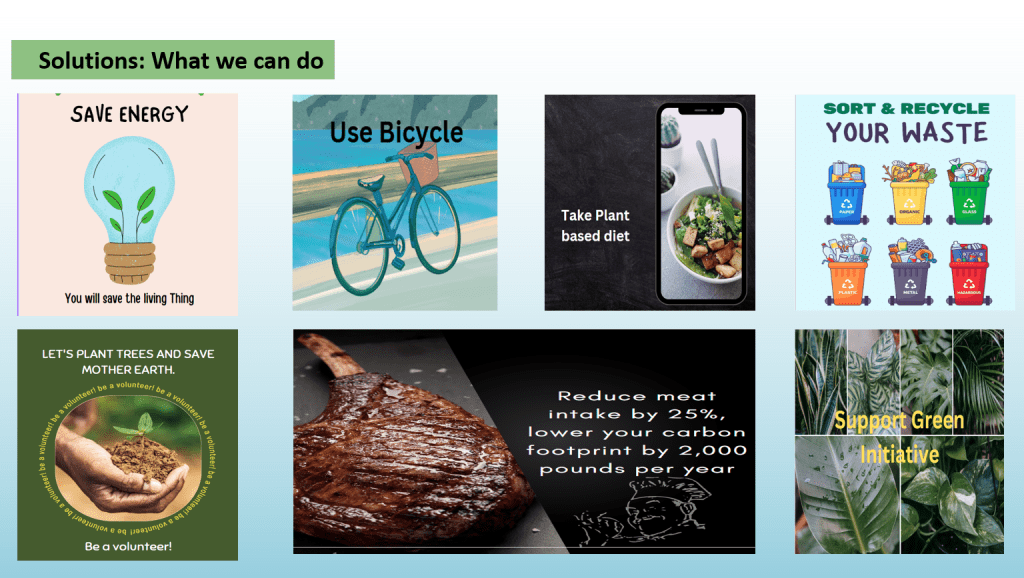
We are all responsible for Global warming at our individual level. This picture is depicting what we need to do in our daily life to reduce carbon footage.
