Redesign Project
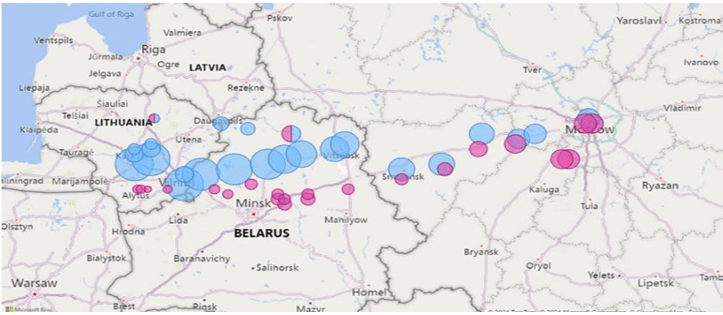
I have completed one redesign project for the story of Mirand. The story tells Napoleon attacked Russia with a huge force of over 350,000 in June 1812. By October, Napoleon’s army had reached Moscow, but severe food shortages had resulted in heavy losses. Moreover, the freezing temperatures, disease, starvation, and ongoing skirmishes further decreased Napoleon’s forces. From an initial 400,000 soldiers, only about 100,000 survived the advance. By the time the army made it back to France in December, fewer than 10,000 remained. I have showcased their journey in Power BI presentation.
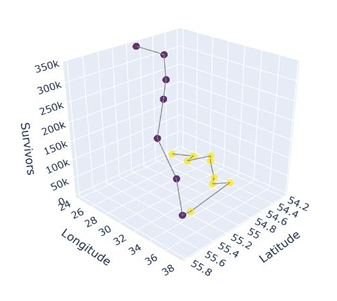
The Napolean army crossed different locations during their journey. If we observe this in 3D view, we can understand the number of survivors and their exact locations during their journey. The black point shows the advance of soldiers while the yellow points are at the time of retreat. I have showcased the journey with a Python presentation.
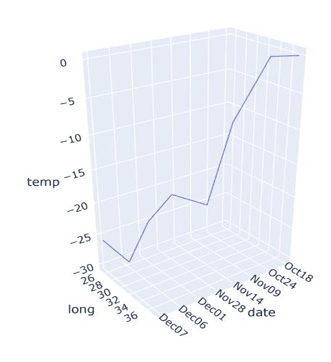
It took them two months to travel back, from October to December, and the temperature dropped from 0 degrees to -30 degrees over time, as shown in the diagram created by Python presentation.
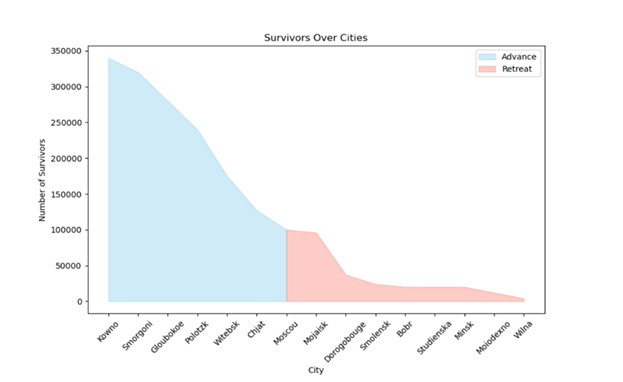
The below diagram depicts how the number of armies dropped over time as they crossed various cities on the way of their journey in the direction of advance and retreat.