Data Analysis and Visualization with Power BI
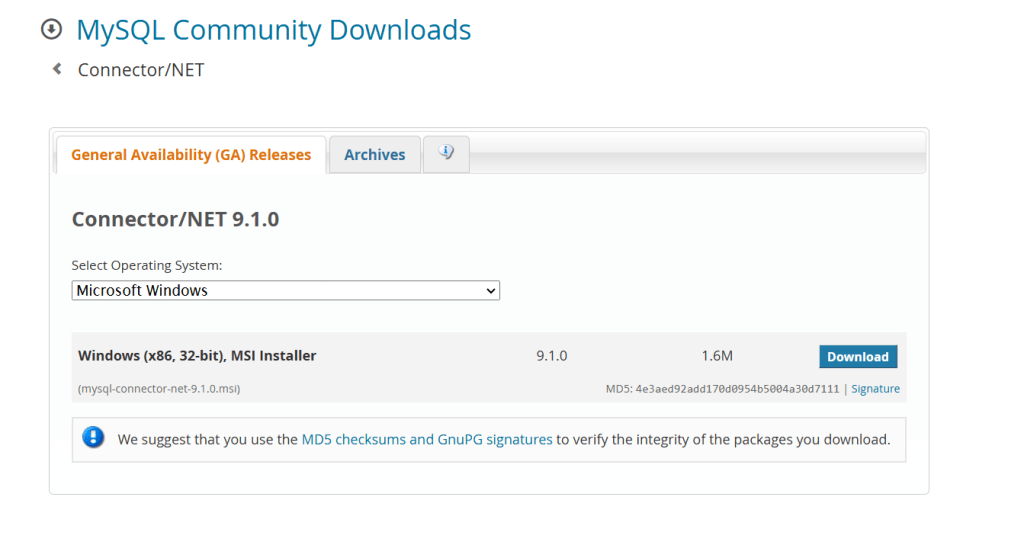
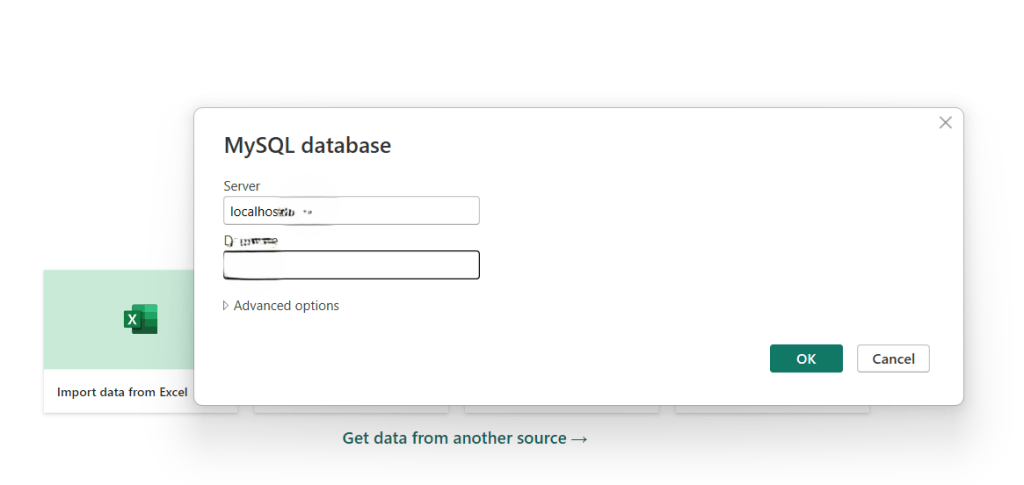
In my last project, I connected Azure SQL and MySQL to Power BI to conduct detailed analyses and create reports and dashboards. To connect MySQL with Power BI, I first needed to install the ODBC connector. Once that was done, I received a pop-up prompt where I could enter the server name and database name to establish the connection.
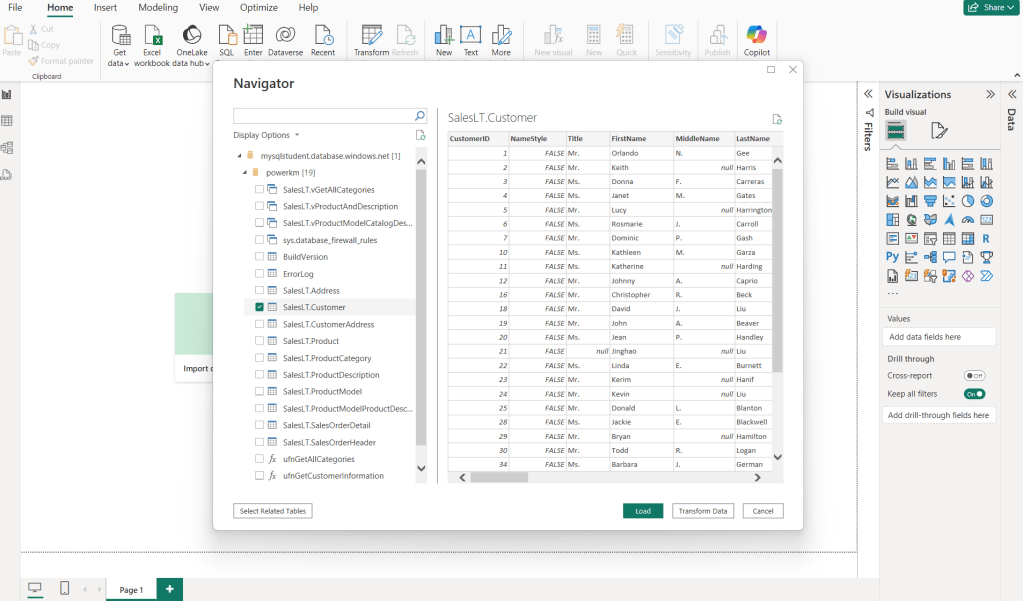
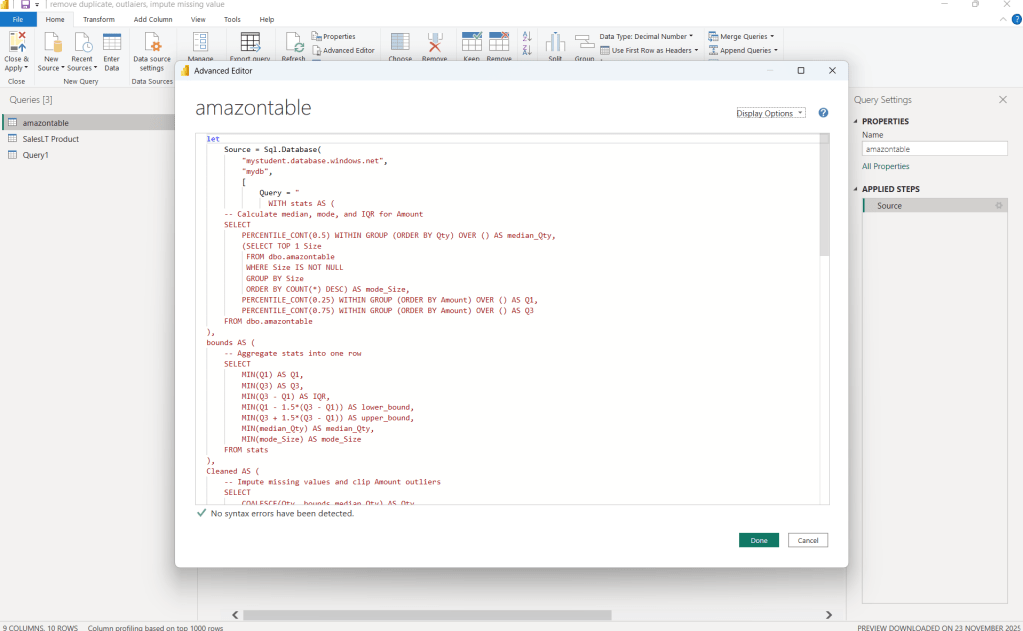
To connect to Azure SQL, I need to provide the server name, database name, and database user ID and password in order to connect with Power BI.
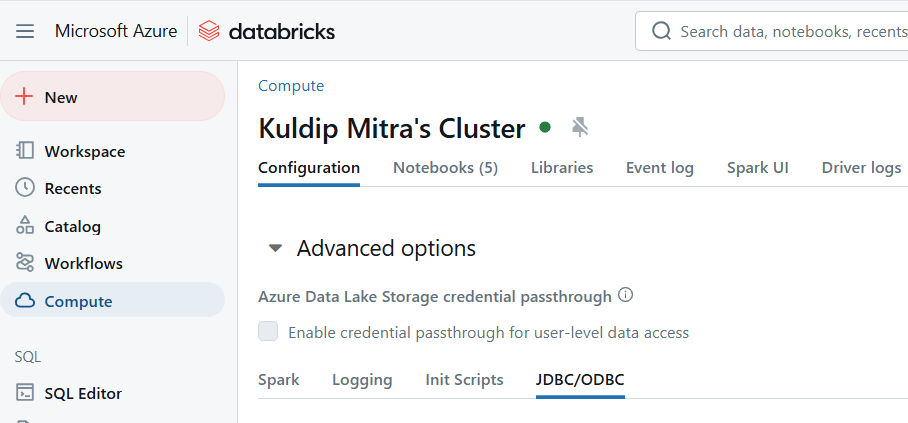
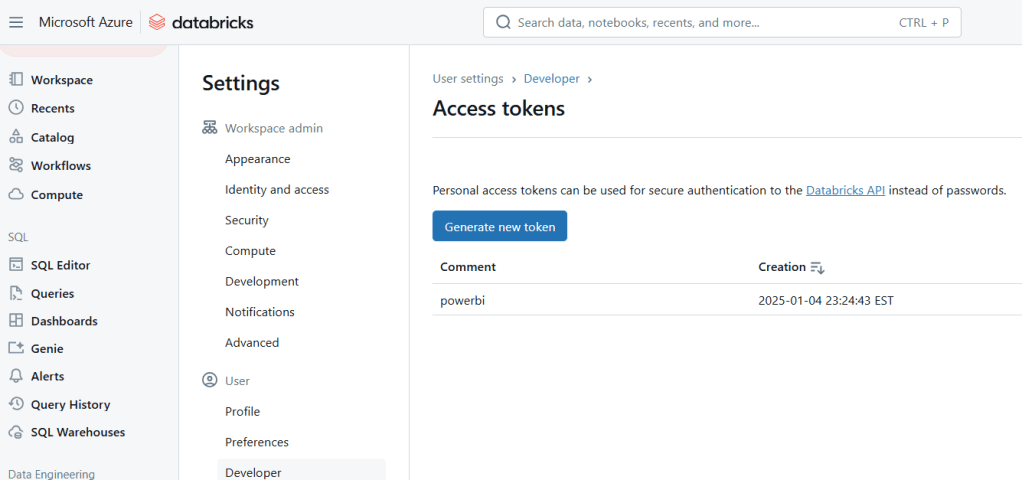
In my projects, I connected Power BI to Databricks using the JDBC connector and an access token. This setup was necessary for conducting data analysis and visualizing the data stored in the data lake.
I used native SQL queries in Power BI to perform complex data-cleaning logic during data load, including missing value imputation, outlier handling, and duplicate identification, ensuring that heavy transformations were pushed down to SQL Server for better performance
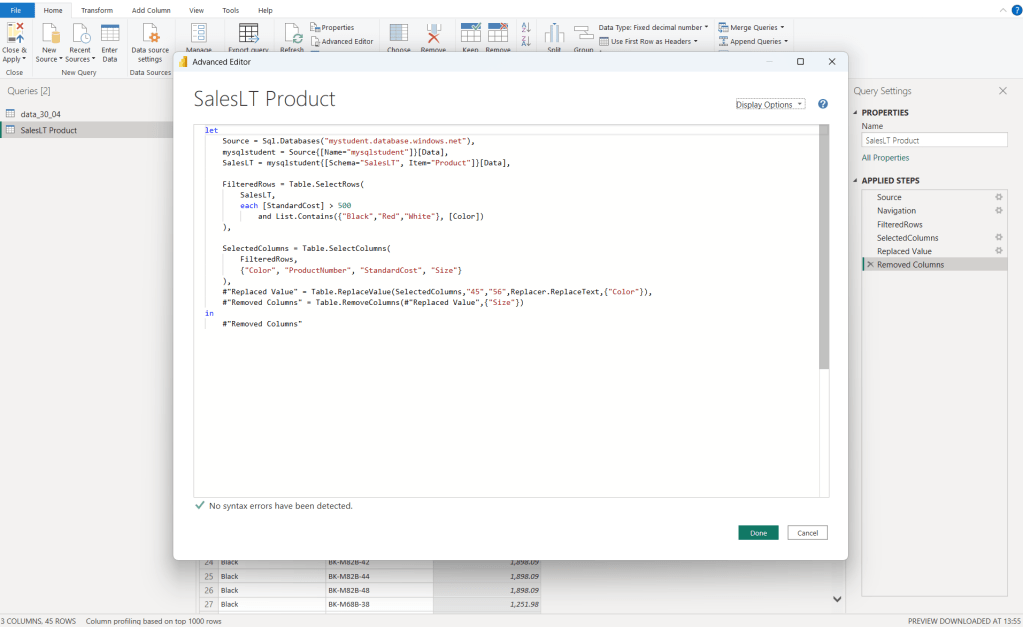
I also leveraged query folding in Power Query for simpler transformations, ensuring calculations were pushed down to SQL Server for optimal performance.
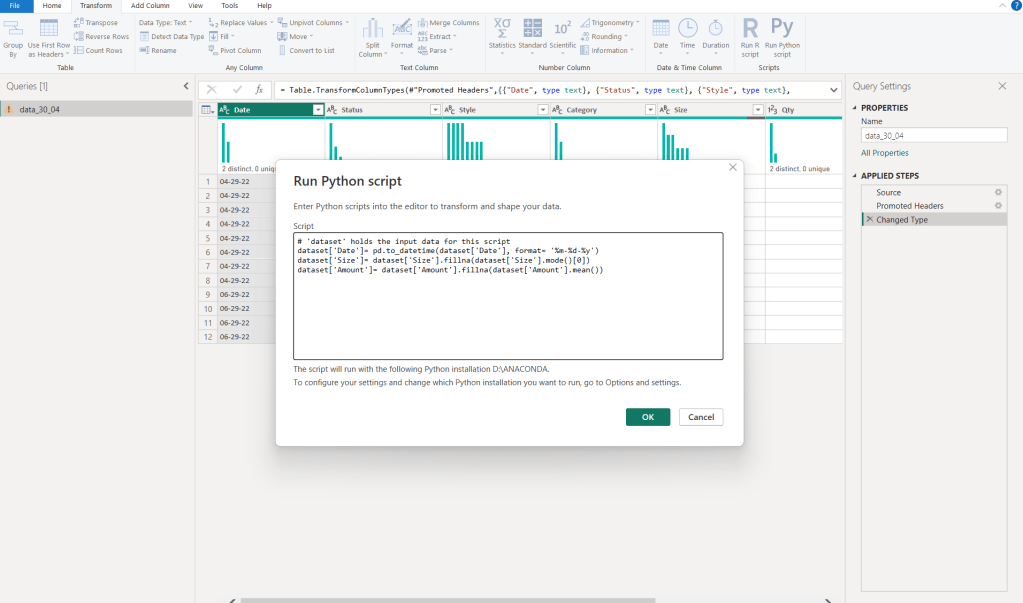
For messy local data, JSON files, and data from Azure Data Lake, I use Python for pre-processing and calculations before loading into Power BI, ensuring clean, structured, and analysis-ready data
I have been working with Power BI for the past six years and have completed numerous projects in both industry and academia. I have attached a few work samples that demonstrate my experience in creating data models, performing DAX calculations, developing visualizations, using Python code in Power BI visualization, applying Row-Level Security (RLS), and creating dashboards in Power BI Service.
