Visualization project
ArcGIS is an excellent tool for creating storytelling visualizations, particularly for those working with location data. We recently completed a project that illustrates the impact of AI on job losses worldwide.
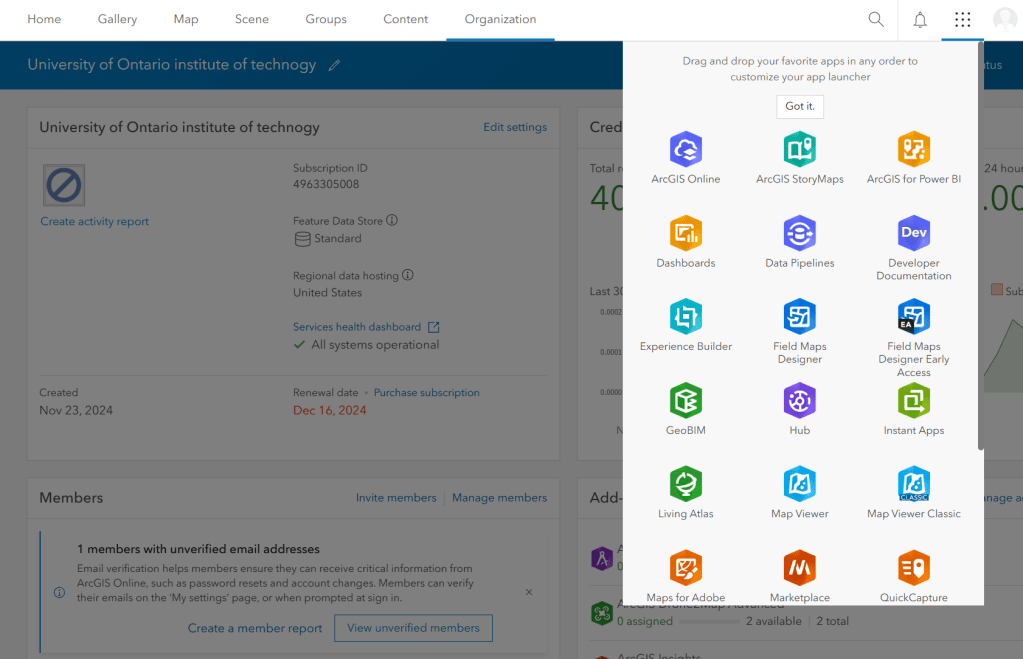
To get started, we obtained a free license from ArcGIS by registering with our college ID. After creating the account, we logged in and began our work. Once logged in, we clicked the Grid icon in the top right corner and selected “ArcGIS StoryMap” to create a new story.
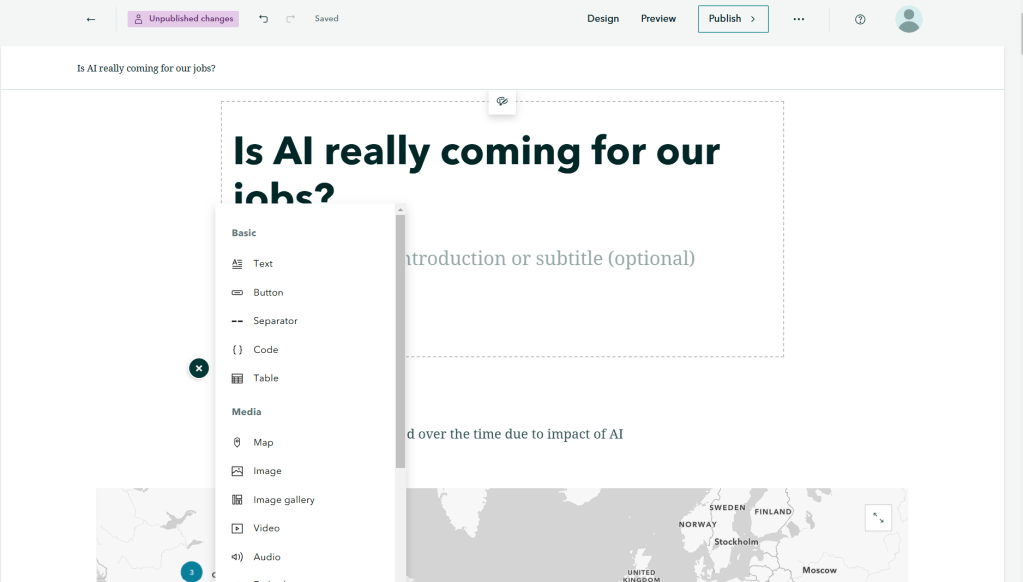
We have begun our story by gathering comprehensive data on job loss worldwide. We have created an eye-catching heading accompanied by effective visualizations. By clicking the “+” option, we can explore various elements such as paragraphs, timelines, maps, and more, all integrated to enhance the flow of the story.
We utilized the sidecar option to incorporate multiple slides, photos, and paragraphs that enhance our scrolling story. Additionally, we included various diagrams and images created in Canva and Power BI to integrate with our narrative.
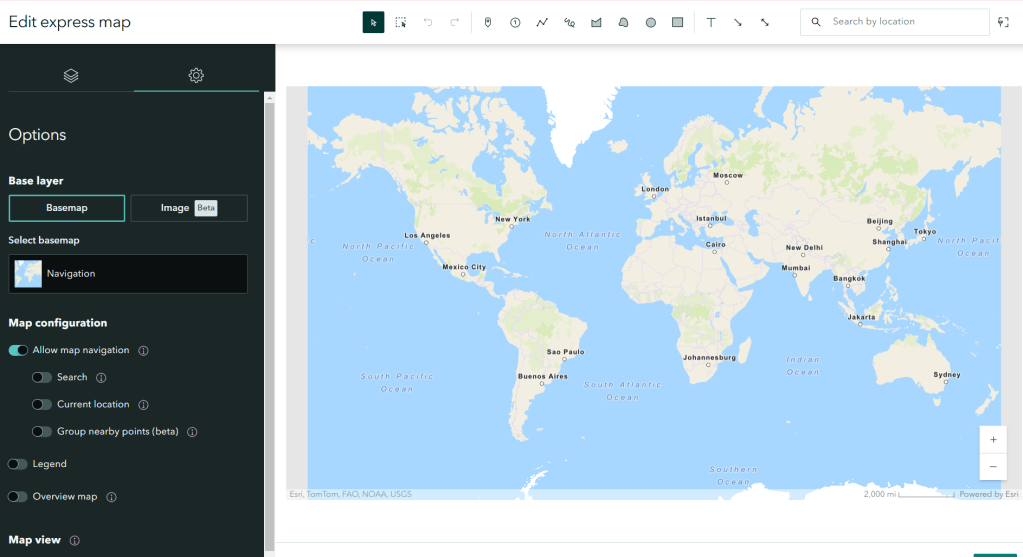
We utilized the map tour feature to display the locations on the map where job losses have occurred. Additionally, we can use 3D animation to visualize the world map.
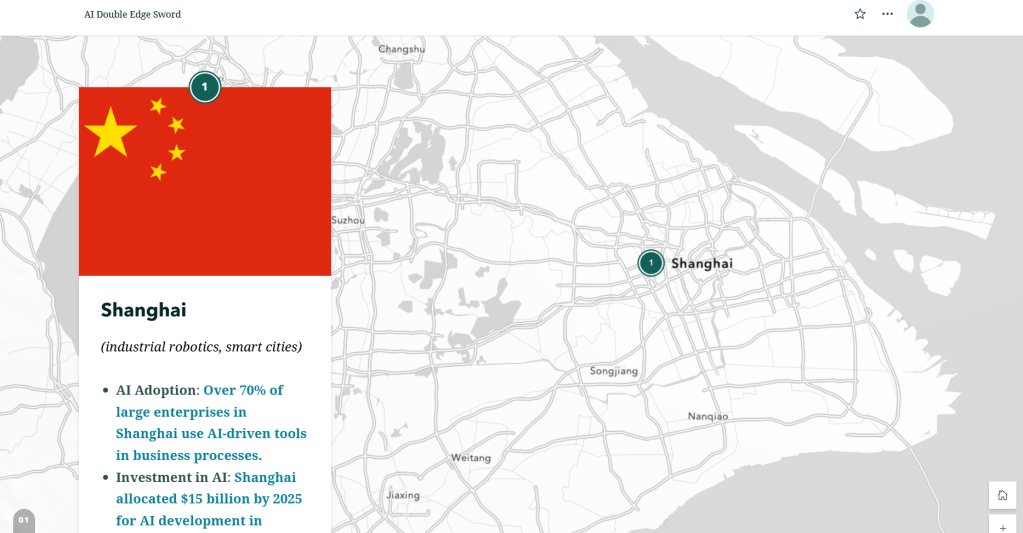
Ultimately, we create a fully scrollable narrative that incorporates 3D world animation.
